Anomaly detection in time series data using BigQuery ML
Create an ARIMA model, then detect anomalies
Let’s say we have a time series dataset of the number of bicycles rented in London every day:
SELECT
  EXTRACT(date from start_date) AS start_date,
  COUNT(*) AS num_trips
FROM `bigquery-public-data.london_bicycles.cycle_hire`
GROUP BY start_date
How can we find unusual days in terms of the number of bicycle rentals?
In BigQuery, all we need are two SQL statements.
1. ARIMA+ Model
First, create an ML model to predict the number of trips on future days using an ARIMA model:
CREATE OR REPLACE MODEL ch09eu.bicycle_daily_trips
OPTIONS(
    model_type='arima_plus',
    TIME_SERIES_DATA_COL='num_trips',
    TIME_SERIES_TIMESTAMP_COL='start_date',
    DECOMPOSE_TIME_SERIES=TRUE
)
AS (
    SELECT
        EXTRACT(date from start_date) AS start_date,
        COUNT(*) AS num_trips
    FROM `bigquery-public-data.london_bicycles.cycle_hire`
    GROUP BY start_date
);
One key thing is that we ask the model to keep track of forecast errors during the modeling using DECOMPOSE_TIME_SERIES. This is so that we can turn around and ask to see the anomalies.
2. Detecting anomalies
Next, detect anomalies (unusual days):
SELECT *
FROM ML.DETECT_ANOMALIES(
    MODEL ch09eu.bicycle_daily_trips,
    STRUCT (0.95 AS anomaly_prob_threshold))
ORDER BY anomaly_probability DESC
LIMIT 10
The result?
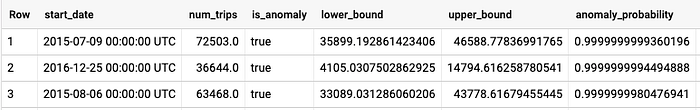
Okay, the second item on the list is Christmas. But why was July 9, 2015 so unusual?
What happened in London on July 9, 2015?
Let’s ask Google.

Ah yes. The subway network was shutdown due to a strike. That’s why there was an unusually high number of bicycle rentals.
Enjoy!